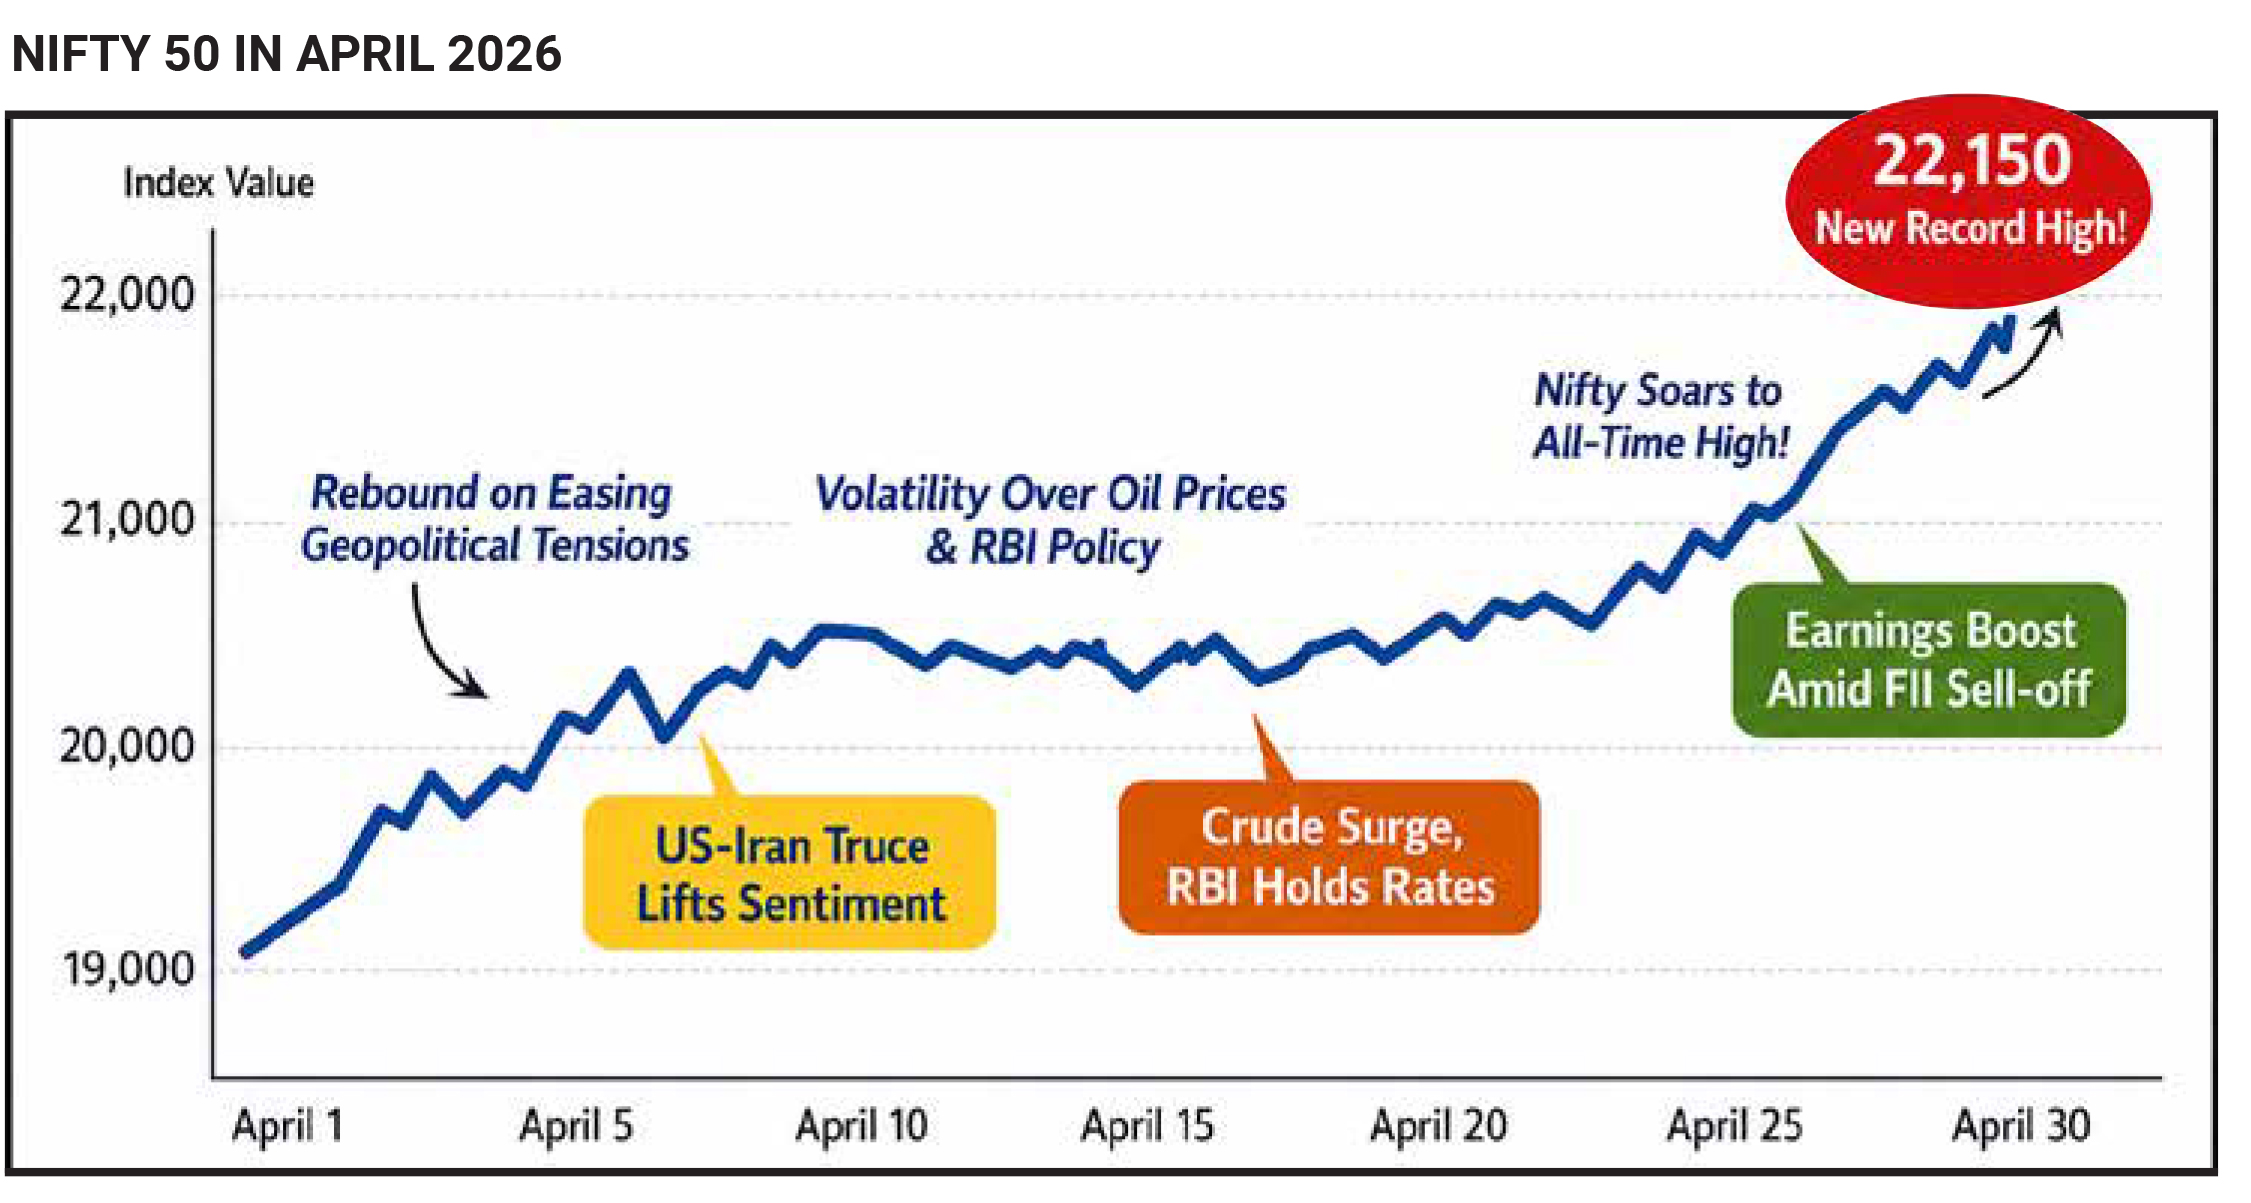
April 2026 marked a powerful turnaround for Indian equity markets, with benchmark indices staging their strongest monthly rally in nearly 28 months after the sharp correction witnessed in March. The Nifty 50 surged by 7.46% during the month, while the BSE Sensex climbed 6.90%, reversing a significant portion of the more than 11% decline recorded in the previous month. This recovery was not just limited to index performance; it was also reflected in a dramatic expansion of overall market wealth. The total market capitalization of all domestically listed companies jumped by nearly ₹51 trillion, reaching an unprecedented ₹463.3 trillion—marking the highest absolute monthly addition ever recorded in Indian market history and surpassing the previous peak increase of ₹28.9 trillion seen in March 2025. The scale and speed of this rebound highlighted the resilience of domestic markets despite persistent global uncertainties and continued selling pressure from foreign investors.
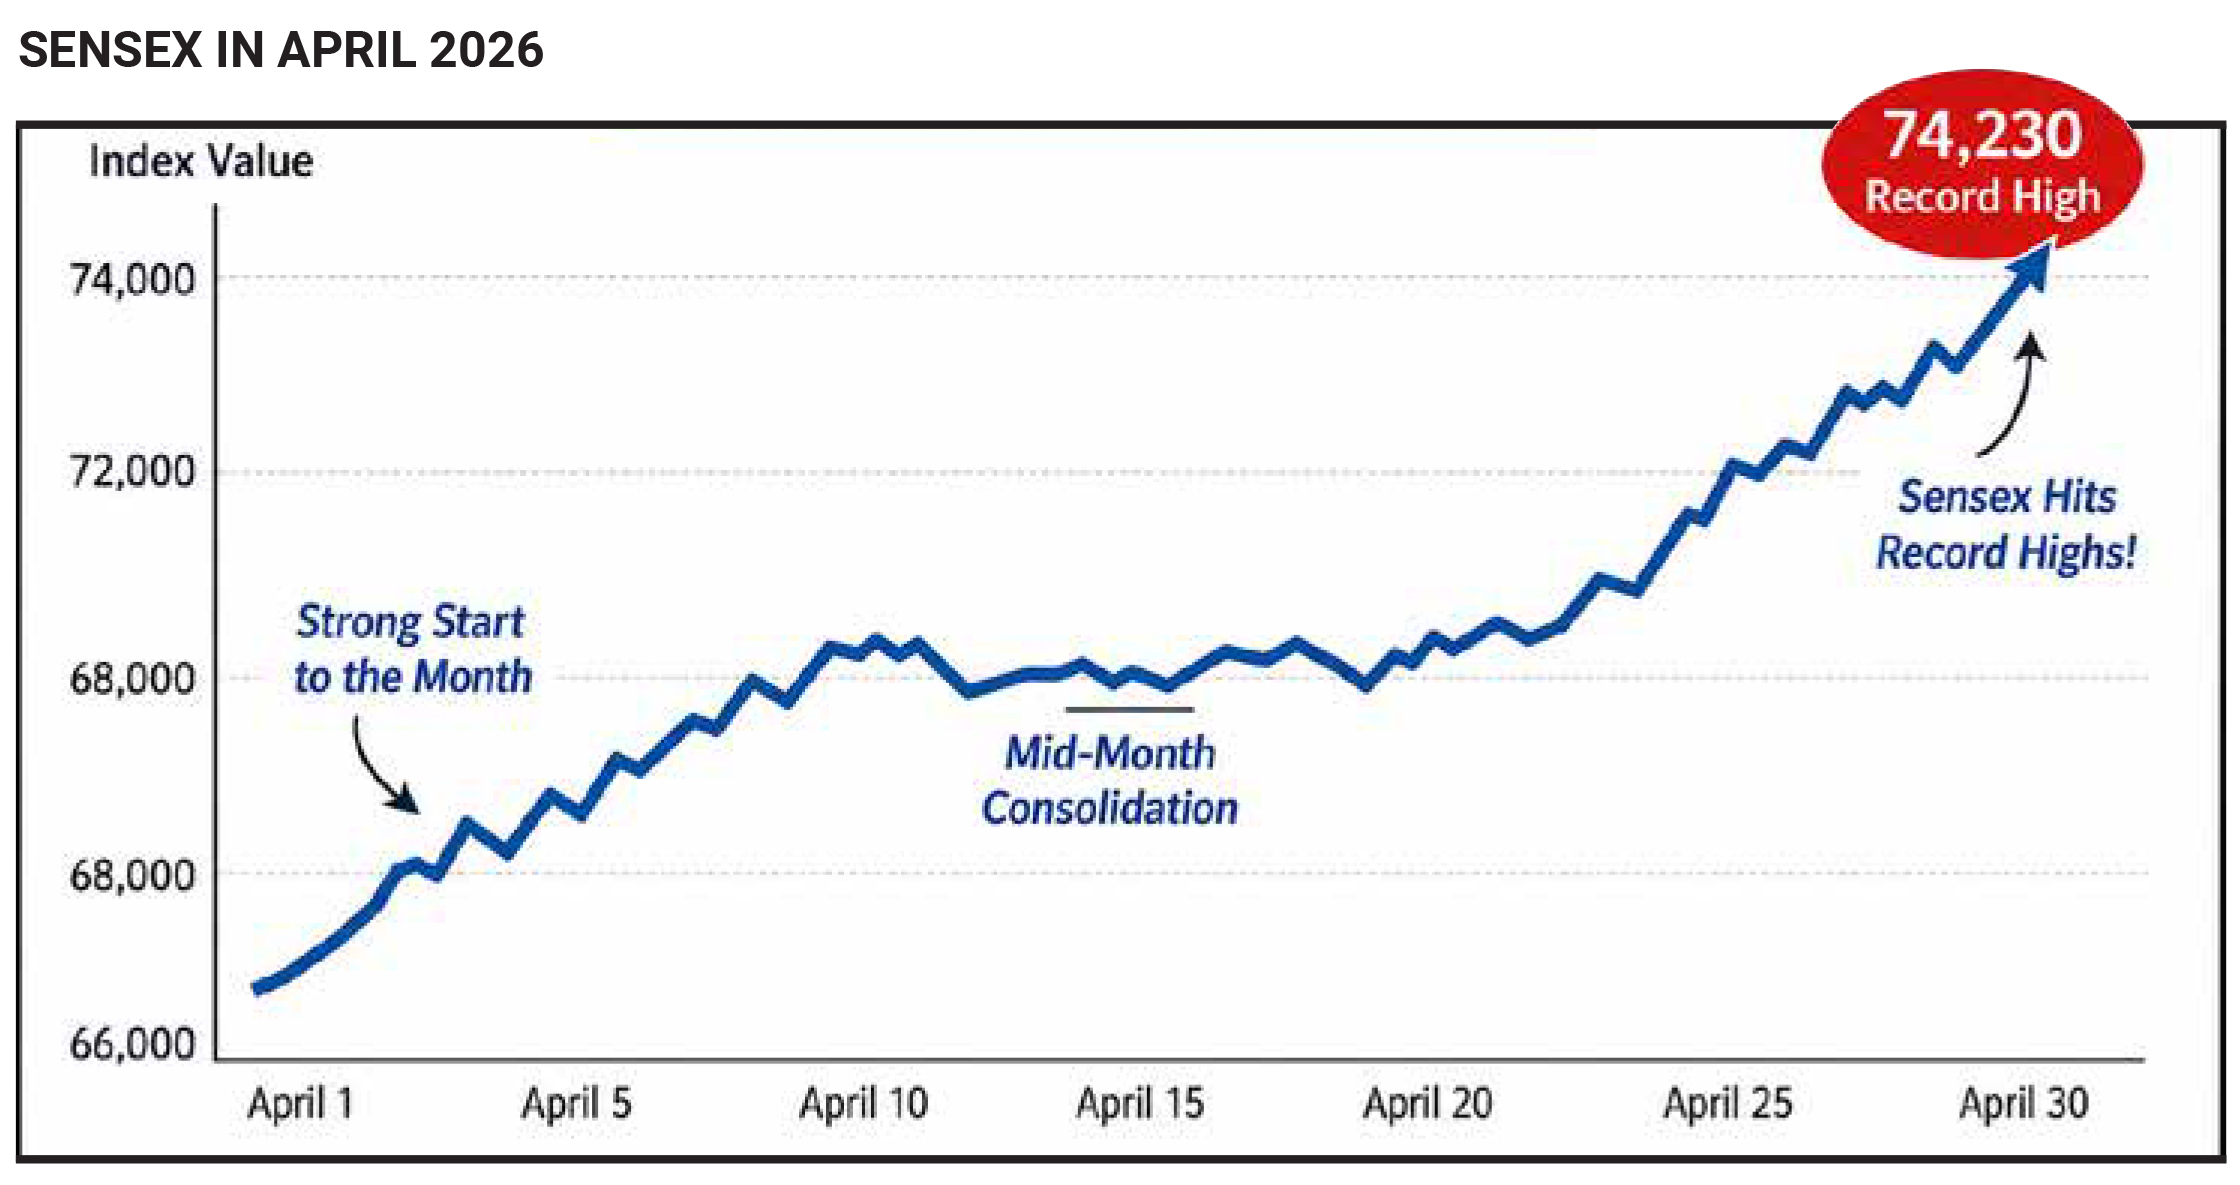
The beginning of April, however, was far from optimistic.
Markets opened the month on a weak note, with indices
declining sharply due to heightened geopolitical
tensions, elevated crude oil prices, and aggressive
foreign institutional investor (FII) outflows. On April 2, the
indices dropped more than 2% in a single session,
reflecting widespread panic triggered by escalating
conflict in West Asia, particularly involving the United
States and Iran. This geopolitical shock had already
rattled markets in March, pushing Brent crude oil prices
above $100 per barrel and intensifying concerns over
inflation, current account deficits, and monetary
tightening in India. However, as the month progressed,
sentiment began to gradually shift. By mid-April, reports
of a ceasefire or de-escalation in tensions between the
United States and Iran helped restore confidence in
global markets. This easing of geopolitical risk acted as
a major catalyst for the rebound in Indian equities.
One of the most crucial macroeconomic variables
influencing market behaviour during this period was
crude oil. India, being a major importer of oil, is highly
sensitive to fluctuations in global crude prices. In early
April, Brent crude hovered in the range of $106–110 per
barrel, raising fears of imported inflation and potential
policy tightening by the Reserve Bank of India. However,
as geopolitical tensions eased, crude prices stabilised
and began to soften slightly, reducing the immediate
pressure on the Indian economy. By early May, Brent
crude had eased to around $107.9 per barrel, providing
further relief to investors. This stabilisation played a key
role in improving sentiment, particularly in rate-sensitive
sectors such as banking, automobiles, and real estate,
which had been heavily impacted during the March
sell-off.
Another important factor shaping market dynamics was
global monetary policy, especially the stance of the
Federal Reserve. Amid rising inflation risks linked to
geopolitical developments, the Federal Reserve chose to
keep interest rates unchanged, while also signalling that
rate cuts in 2026 were unlikely. This created intermittent
pressure on global equity markets, including India, as
higher-for-longer interest rates tend to reduce liquidity
and dampen risk appetite. Despite this, Indian markets
demonstrated relative resilience, supported by strong
domestic fundamentals and investor participation.
Sectoral trends also played a significant role in driving
the April rally. In the latter half of the month, strong
buying was observed in sectors such as fast-moving
consumer goods (FMCG), automobiles, and real estate.
Leading companies including ITC Limited, Tech
Mahindra, Maruti Suzuki, and Reliance Industries
emerged as key contributors to index gains. The
performance of the automobile sector was particularly
noteworthy, supported by strong domestic demand data.
For instance, Maruti Suzuki reported record domestic
sales of 1,91,122 units in April 2026, compared to
1,42,053 units in April 2025, signalling robust
consumption trends and boosting investor confidence in
cyclical sectors.
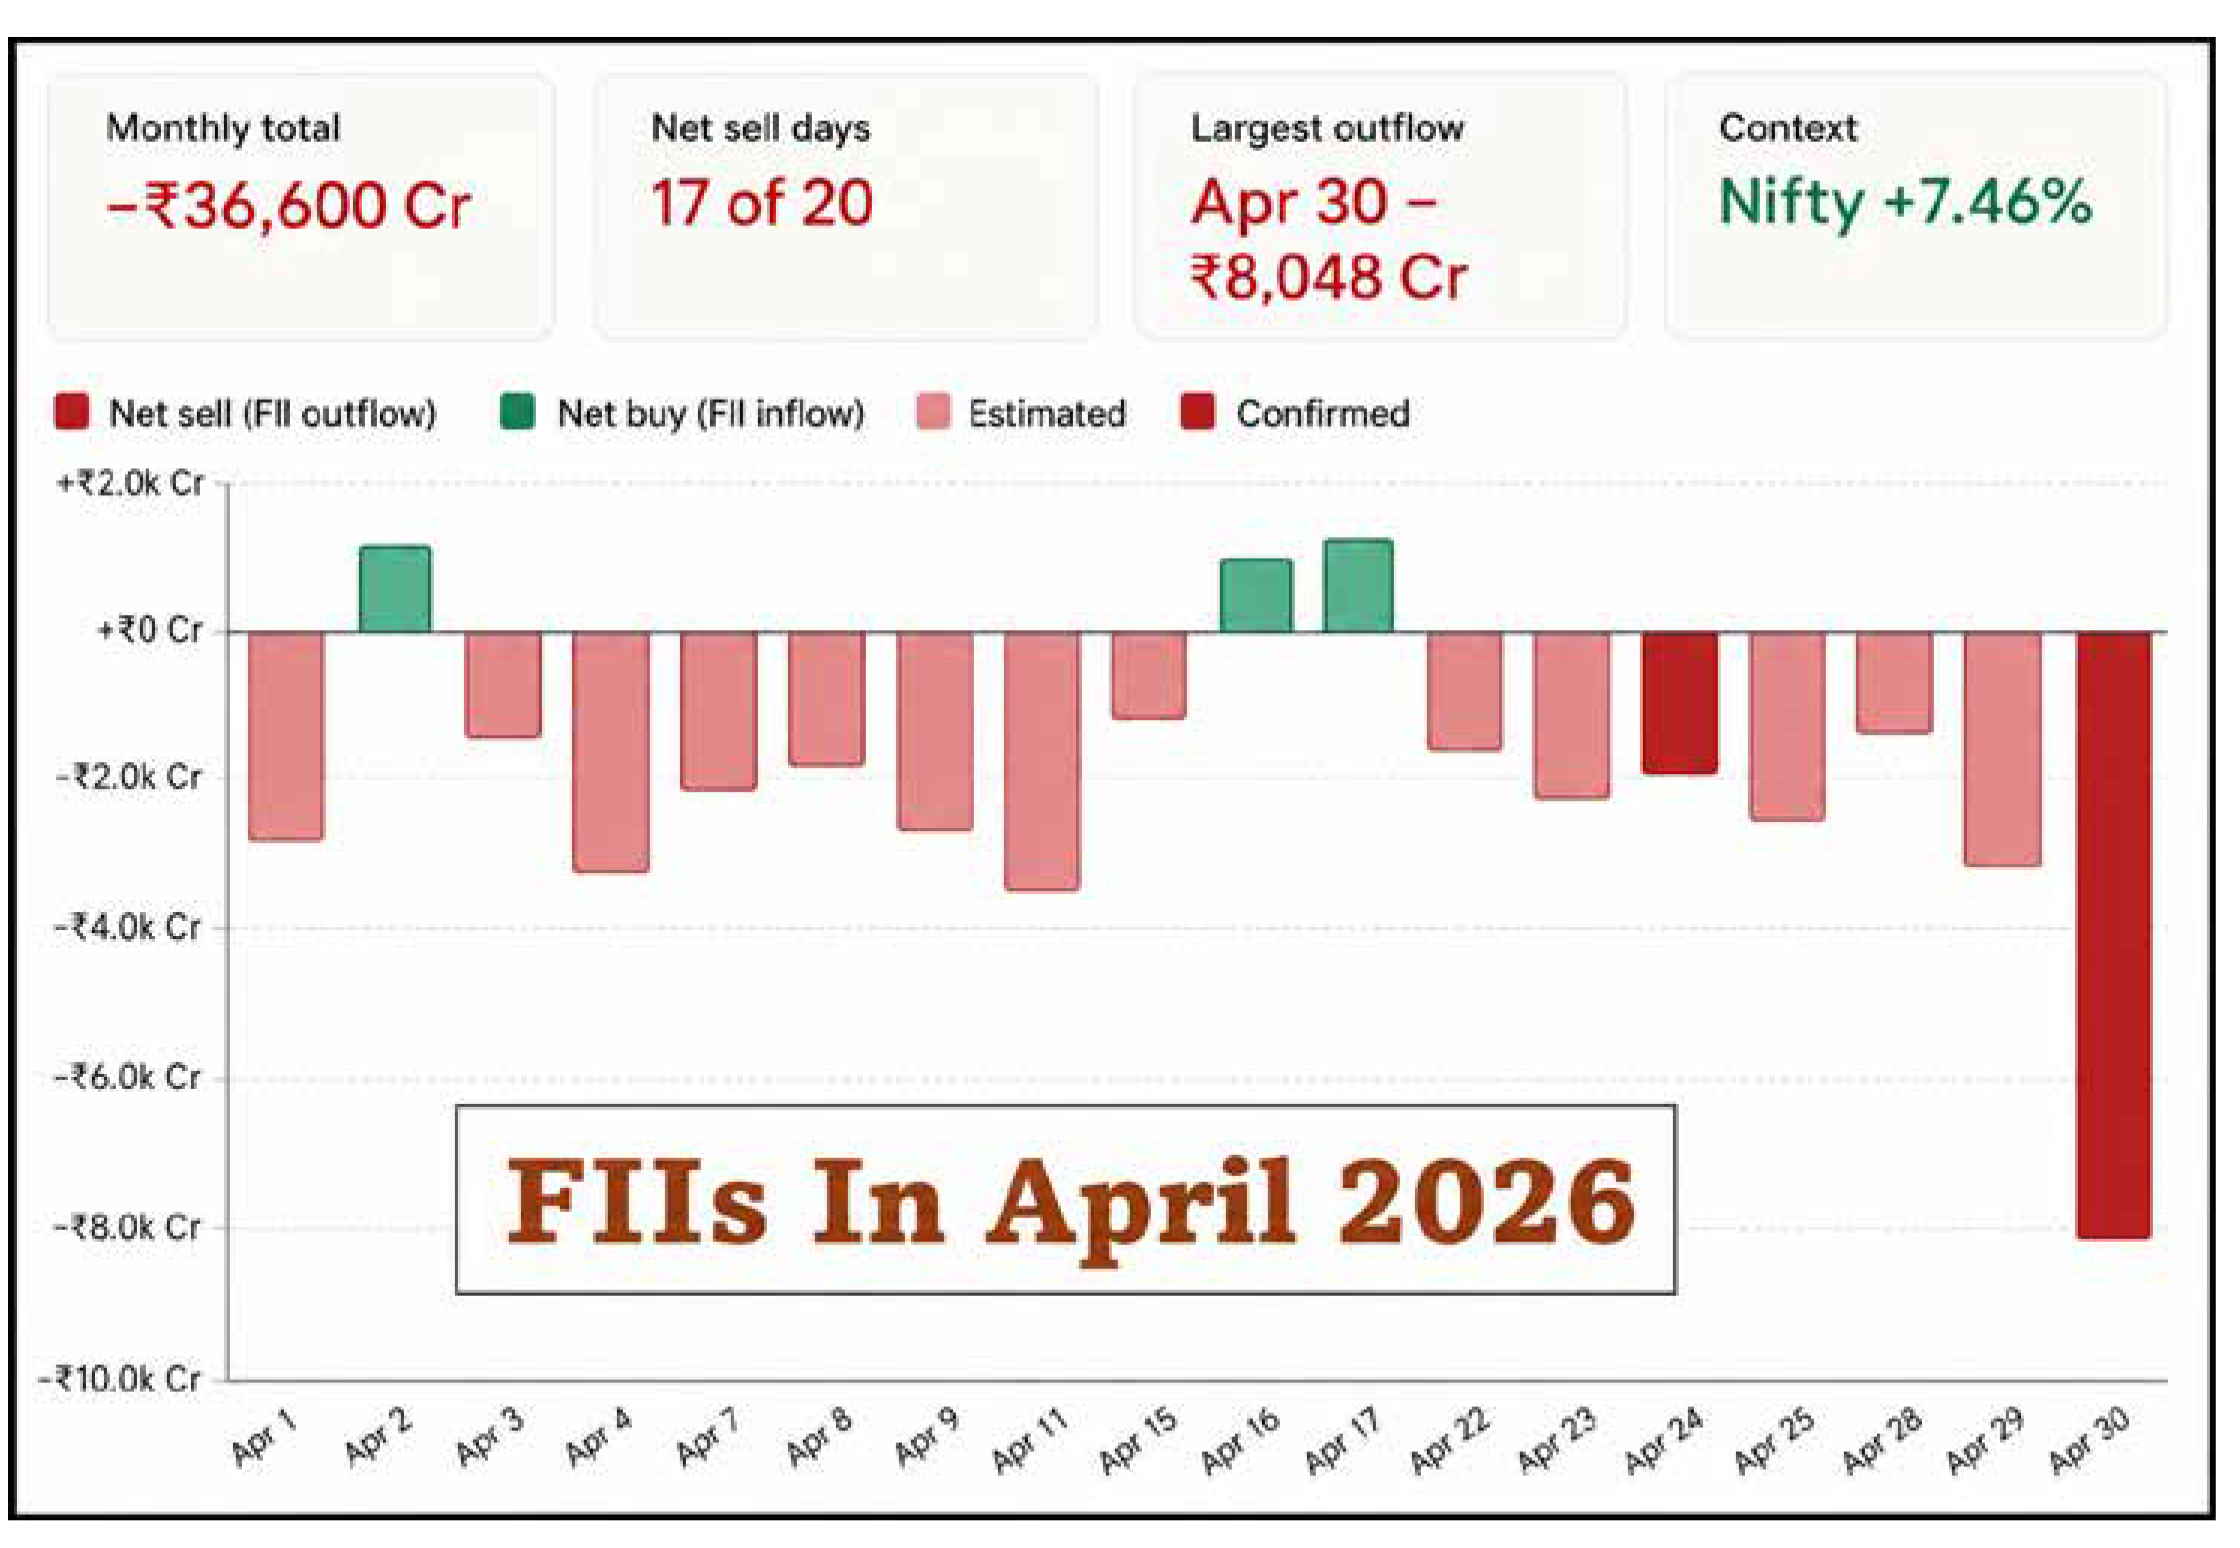
Despite these positive developments, the underlying
market structure remained complex due to the
divergence between foreign and domestic investor
behaviour. FIIs continued to be aggressive sellers
throughout April, offloading equities worth
approximately ₹43,000–44,000 crore in the cash
segment. This sustained selling was a continuation of
the heavy outflows seen in March and reflected global
risk aversion, currency pressures, and relatively more
attractive yields in developed markets. Under normal
circumstances, such persistent FII selling would have
exerted significant downward pressure on the indices.
However, this time, domestic institutional investors
(DIIs) and retail participants played a crucial
counterbalancing role. DIIs invested over ₹34,000 crore
during the month, while steady inflows from retail
investors—particularly through systematic investment
plans (SIPs)—provided additional support. This created
a dynamic “tug of war” in the market, where FII selling
dragged indices down while DII and retail buying helped
stabilise and eventually push them higher.
Liquidity conditions and currency stability further
contributed to the positive momentum. While the Indian
rupee remained under pressure, it did not experience any
sharp or disorderly depreciation. The Reserve Bank of
India’s liquidity management measures, combined with
consistent domestic inflows, prevented any systemic
stress in financial markets. This stability allowed the
broader “India growth story”—characterised by strong
consumption, infrastructure development, and a robust
capital expenditure cycle—to regain prominence in
investor narratives. Public sector undertakings (PSUs)
and promoter-driven companies saw renewed interest
during the rally.
By the end of April 2026, the Sensex was trading in the
range of approximately 77,500 to 78,500, while the Nifty
settled between 24,100 and 24,400, marking a
substantial recovery from their March lows. The
momentum carried into early May as well. On May 4,
2026, after ending the previous week on a weak note,
markets opened strongly, with the Sensex rising over 997
points to touch 77,910 and the Nifty gaining 292 points to
reach 24,290 in early trade. However, investor sentiment
remained somewhat cautious due to the ongoing state
election results, which had the potential to influence
short-term market direction.
In summary, April 2026 represented a classic case of a
sharp correction followed by a strong technical and
sentiment-driven rebound. The recovery was fuelled by
easing geopolitical tensions, stabilising crude oil prices,
supportive domestic economic data, and strong
participation from domestic investors. Even though
foreign investors remained net sellers throughout the
period, their impact was effectively absorbed by
domestic flows, allowing the market to post its best
monthly performance in over two years. The interplay
between global uncertainties and domestic resilience
defined the market narrative, reinforcing the importance
of internal demand and liquidity in sustaining India’s
equity market momentum.
In April 2026, India’s debt markets faced a broad-based
selloff as yields repriced sharply upward in response to
geopolitical tensions in West Asia, rising crude oil prices,
and mounting inflation concerns. This environment
proved particularly challenging for interest
rate–sensitive instruments, especially government
securities (G-secs) and long-duration debt funds. As
yields climbed across the curve, bond prices declined,
leading to negative returns in several fixed-income
categories. However, the impact was not
uniform—shorter-duration instruments and
credit-oriented products displayed relative resilience,
supported by lower duration risk and stable credit
spreads.
Government securities bore the brunt of the adjustment.
The 10-year benchmark yield rose significantly, moving
from roughly 6.6–6.7% in early March to around
6.9–7.0% by late April, even touching a two-week high of
approximately 6.98% in mid-April. This upward
movement reflected a reassessment of inflation risks
and expectations of tighter monetary conditions.
Notably, the repricing was more pronounced at the short to mid-end of the yield curve. Yields on 2-year and 3-year
G-secs climbed steadily as markets began pricing in
near-term inflation pressures and the likelihood of
liquidity tightening by the Reserve Bank of India (RBI).
Similarly, 5-year bonds experienced upward pressure as
traders positioned for a less accommodative liquidity
environment. At the long end, 20- to 30-year bonds
underperformed further, as investors demanded higher
term premiums to compensate for fiscal uncertainties
and persistent inflation risks.
Corporate bond markets also reflected the broader
tightening in financial conditions, though with variations
across credit quality and sectors. Investment-grade
corporate bonds experienced moderate price pressure,
but in some cases, spreads tightened slightly, especially
in sectors linked to India’s capital expenditure cycle. This
resulted in largely flat to mildly negative returns for
top-rated instruments. In contrast, lower-rated or
high-yield bonds faced greater stress. Investors grew
increasingly cautious amid rising borrowing costs and
heightened volatility, leading to wider spreads and
weaker secondary market prices for these issuers.
Several interrelated factors drove these developments.
Foremost among them was the escalation of
geopolitical tensions in West Asia, which pushed Brent
crude oil prices sharply higher, in some instances
approaching or exceeding $100 per barrel. For an
oil-importing country like India, this translated into fears
of imported inflation, with potential knock-on effects on
both consumer and wholesale price indices. As inflation
expectations rose, markets began to anticipate a more
hawkish stance from the RBI, including the possibility of
prolonged higher policy rates. This led to a front-loading
of rate expectations, particularly impacting shorter-tenor
bonds.
At the same time, global bond markets experienced a
surge in volatility, reflected in rising rate volatility
indicators similar to the MOVE index. Yield curves
flattened globally, but at higher absolute levels, signalling
that investors were demanding greater compensation
for uncertainty. Indian bond markets followed suit, with
the rise in the 10-year yield reflecting not just inflation
expectations but also an increase in term premiums.
Liquidity and fiscal concerns further amplified the
upward pressure on yields. Expectations of tighter
domestic liquidity—driven by a higher import bill,
potential capital outflows during risk-off conditions, and
pressure on money market rates—made short-term
instruments more sensitive to rate changes. Meanwhile,
concerns about fiscal slippage, including higher
government spending on energy subsidies and possible
war-related expenditures, pushed long-term yields higher
as investors reassessed India’s fiscal trajectory.
Despite these pressures, the RBI played a stabilizing role
in the market. Through targeted open market operations
and secondary market purchases of government bonds,
the central bank helped anchor the 10-year yield,
preventing excessive volatility. However, this support
was concentrated around the benchmark segment,
leaving shorter- and longer-tenor bonds more exposed to
market-driven repricing.
Investor behaviour also influenced market outcomes.
Retail and institutional investors increasingly shifted
allocations toward shorter-duration and credit-focused
funds, seeking to mitigate interest rate risk. These flows
helped stabilize segments of the market and prevented a
disorderly selloff. However, investors with exposure to
long-duration gilt funds faced significant mark-to-market
losses, as rising yields eroded bond prices despite steady
coupon income.
In the corporate bond segment, yield movements closely
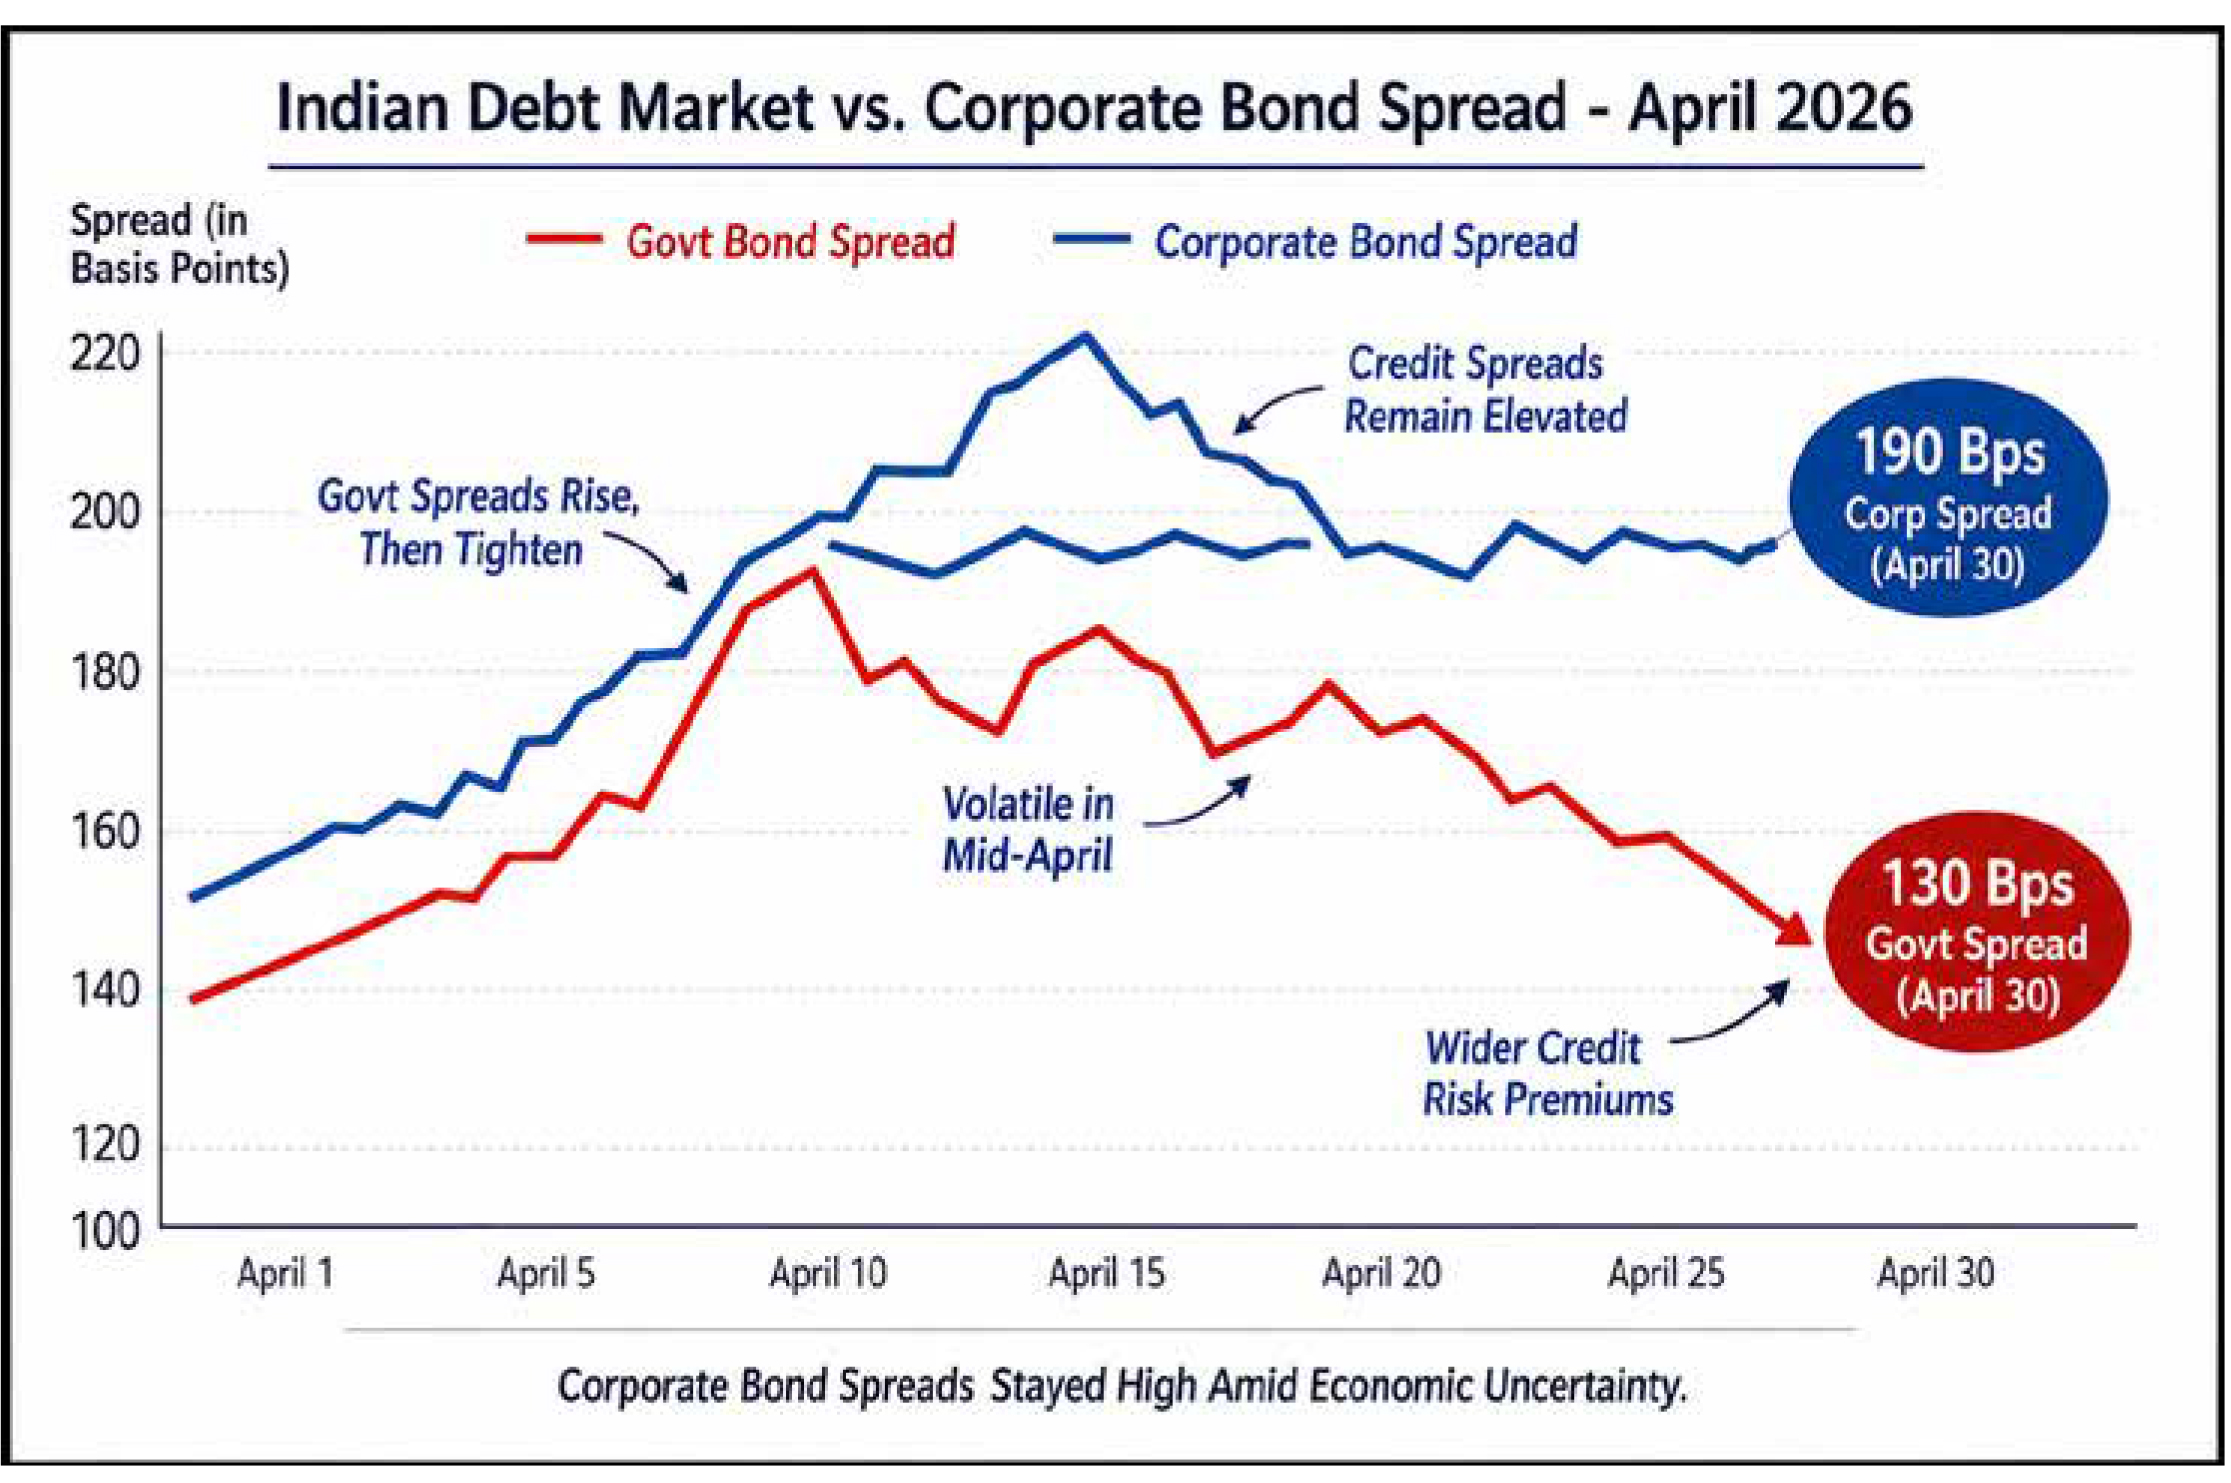
tracked changes in government bond yields but were
further influenced by credit risk considerations.
Top-rated AAA and A1 issuers saw yields rise by around
20–30 basis points, while BBB-rated and lower-quality
issuers experienced more substantial increases of
40–60 basis points or more. Sectoral differences were
also evident. Industries heavily dependent on crude oil or
global trade—such as aviation, shipping, refining, and
certain manufacturing segments—saw sharper yield
increases due to concerns about margin compression
and earnings volatility. Conversely , defensive sectors
like large public sector enterprises, regulated utilities,
and select financial institutions experienced more
moderate yield movements, supported by stable cash
flows and, in some cases, implicit government backing.
In essence, April 2026 underscored the vulnerability of
debt markets to external shocks and the critical
importance of duration management. While rising yields
created near-term pain through capital losses, they also
reset the yield environment to more attractive levels for
future investors, particularly in shorter-duration and
high-quality segments.
In April 2026, bullion markets—especially gold and
silver—moved within a broadly upward but highly volatile
range, shaped by geopolitical tensions, crude-driven
inflation fears, and evolving global monetary policy
expectations. Gold clearly outperformed, supported by
strong safe-haven demand and structural tailwinds,
while silver lagged due to its sensitivity to industrial
demand and macroeconomic uncertainty. The month
reflected a “risk-off but rate-sensitive” environment: gold
benefited from geopolitical stress but faced intermittent
pressure from higher interest rate expectations, whereas
silver struggled to sustain gains.
Gold prices in India and globally showed sharp swings
followed by consolidation. At the beginning of April,
domestic 24-karat gold was around ₹1,50,100 per 10
grams. However, on April 2, prices briefly dropped to
about ₹1,45,600 due to profit booking, a stronger US
dollar, and global liquidity pressures. This fall was
short-lived and largely technical, following a steep rally
linked to safe-haven demand. By mid-April (around April
17–19), gold surged to a monthly high near ₹1,55,000 per
10 grams, driven by escalating West Asia tensions, rising
crude oil prices, and seasonal demand during the
Akshaya Tritiya period. Toward the end of the month,
prices stabilized near ₹1,51,000 per 10 grams, leaving
gold modestly higher overall.
On MCX, gold futures reflected similar volatility. For
example, on April 14, June gold futures rose nearly ₹2,000
(about 1.3%) in a single session, highlighting rapid
sentiment shifts. Retail gold prices in Indian cities
remained strong, hovering around ₹15,400–₹15,500 per
gram at peak levels, indicating resilient domestic demand
despite high prices.
Silver, however, underperformed throughout April. It
initially traded around ₹2.64–2.65 lakh per kilogram in
mid-April but failed to sustain these levels. By late April,
prices fell to the ₹2.35–₹2.44 lakh range, reflecting
weaker momentum. This divergence widened the
gold–silver ratio, emphasizing gold’s strength as a
defensive asset compared to silver’s dual industrial and
precious metal role.
The primary driver of bullion movements was the
escalation of geopolitical tensions in West Asia,
particularly involving the US and Iran. These
developments triggered safe-haven buying, with analysts
estimating a “war risk premium” of about $10–15 per
ounce in gold prices. However, periodic ceasefire talks
led to profit booking, contributing to volatility.
Structural demand factors added further strength. Global
central banks continued to accumulate gold as part of
reserve diversification, while limited growth in mining
supply reinforced the tight supply narrative. Investor
flows also played a key role: gold ETFs saw strong
inflows globally and in India, as investors sought
protection against geopolitical and market risks. These
inflows helped gold resist deeper corrections.
Domestic factors in India further supported gold
prices. Seasonal demand from weddings and festivals,
especially around Akshaya Tritiya, sustained physical
buying even at high price levels. Jewellers maintained
firm premiums, limiting downside risks. Silver did not
benefit similarly, as its demand is more tied to
industrial activity, which weakened amid concerns
about slower global growth and higher interest rates.
The sharp fall on April 2 highlights the market’s
volatility. This drop was driven by a stronger US dollar,
profit booking after a rapid rally, and easing crude
prices. Additionally, geopolitical rhetoric initially
boosted the dollar, prompting liquidation of leveraged
gold positions. On MCX, prices briefly fell sharply
before recovering, indicating a technical correction
rather than a trend reversal.
Overall, April 2026 saw a volatile but upward-trending
bullion market. Gold remained resilient and
outperformed due to its safe-haven appeal,
inflation-hedging properties, and strong investment
demand. Silver lagged due to its industrial exposure
and sensitivity to macro tightening. The interplay of
geopolitical risks, crude prices, monetary policy, and
investor behaviour defined the market, reinforcing
gold’s role as a key defensive asset in uncertain times.
In April 2026, the Indian rupee (INR) experienced an
exceptionally volatile and weakening trend against the
US dollar (USD), driven primarily by external shocks
rather than domestic economic weakness. The currency
came under sustained pressure throughout the month,
reflecting a combination of surging crude oil prices,
geopolitical tensions in West Asia, global monetary
tightening, and significant capital outflows. While some
data points suggest extreme depreciation toward the
₹95 mark, the broader and more consistent market
narrative indicates that the rupee moved within a sharply
volatile but controlled depreciating range, weakening
from around ₹82.8–83.2 per USD in late March to
approximately ₹83.8–84.5 by the end of April. This made
April one of the most turbulent months for the rupee in
recent times, marked by sharp swings rather than a
one-directional collapse.
The rupee’s movement over the month reflected shifting
global sentiment. Early in April, the currency came under
pressure as crude oil prices surged and risk aversion
increased, pushing it past the ₹83 mark. Around
mid-April, there were brief phases of stabilization and
even mild recovery, supported by temporary easing in
geopolitical tensions and intervention by the Reserve
Bank of India. However, these gains proved short-lived,
and by the latter part of the month, the rupee weakened
again toward the ₹84+ zone as external pressures
persisted and demand for dollars remained strong.
Overall, the rupee displayed a pattern of high volatility
with a clear depreciation bias.
The primary driver of this weakness was the sharp rise in
crude oil prices due to escalating conflict in West Asia.
Brent crude surged toward $100–110 per barrel,
significantly increasing India’s import bill. As India
imports over 80–90% of its crude requirements, higher
oil prices led to a surge in demand for US dollars by oil
marketing companies to finance imports. This placed
direct downward pressure on the rupee and worsened
the current account deficit outlook, further weakening
currency sentiment.
Geopolitical tensions also triggered a global “risk-off”
environment. Investors shifted capital toward safe-haven
assets such as the US dollar and gold, leading to
outflows from emerging markets like India. Foreign
institutional investors (FIIs) pulled out substantial funds
from Indian equities and debt markets, intensifying dollar
demand and adding to rupee depreciation. This flight to
safety was reinforced by uncertainty surrounding global
trade routes and energy supply disruptions.
Another key factor was the strength of the US dollar,
supported by the US Federal Reserve’s “higher for
longer” interest rate stance. Elevated US yields attracted
global capital into US assets, reducing the relative
attractiveness of emerging market investments. This
narrowing of interest rate differentials exerted additional
pressure on the rupee, as capital moved away from India
toward safer, higher-yielding US instruments.
Inflation dynamics further compounded the situation.
Rising crude prices and a weakening rupee created a
feedback loop—higher oil costs increased imported
inflation, while a weaker currency made imports even
more expensive. This heightened concerns about
inflation in India and reduced expectations of monetary
easing, reinforcing the negative sentiment around the
rupee.
Despite these pressures, the RBI played a crucial
stabilizing role. It intervened actively in the foreign
exchange market by selling dollars from its reserves and
using liquidity tools to prevent excessive volatility. While
the central bank did not attempt to defend a specific
exchange rate level, its actions helped contain the
rupee’s depreciation within a manageable range and
avoided a disorderly. Some domestic factors also
provided limited support. Continued inflows from
domestic institutional investors, relatively stable
macroeconomic fundamentals, and steady foreign
direct investment and services exports helped cushion
the impact of external shocks. In summary, April 2026 was a pressure-heavy month for the rupee, shaped by a “perfect storm” of high oil prices, geopolitical uncertainty, global risk aversion, and strong US dollar dynamics. The rupee weakened under these external stresses but remained relatively stable compared to more severe scenarios, thanks to timely RBI intervention and underlying economic resilience.
In April 2026, crude oil prices experienced an
extraordinary and highly volatile surge, driven by a
combination of severe geopolitical disruptions, supply
shocks, and structural market tightness. Prices moved
from an already elevated base into a full-blown crisis
zone, with Brent crude rising from roughly $94–100 per
barrel at the start of the month to peak at an intraday
high of about $126.10 by April 30, while WTI crude
climbed to around $110.24. Even after some late-month
cooling, Brent remained elevated in the $108–112 range,
marking one of the sharpest monthly rallies in recent
years. Overall, crude followed a
“spike–pullback–consolidation” pattern, characterized
by extreme intraday volatility and rapid reactions to
geopolitical developments, ultimately ending the month
significantly higher than where it began.
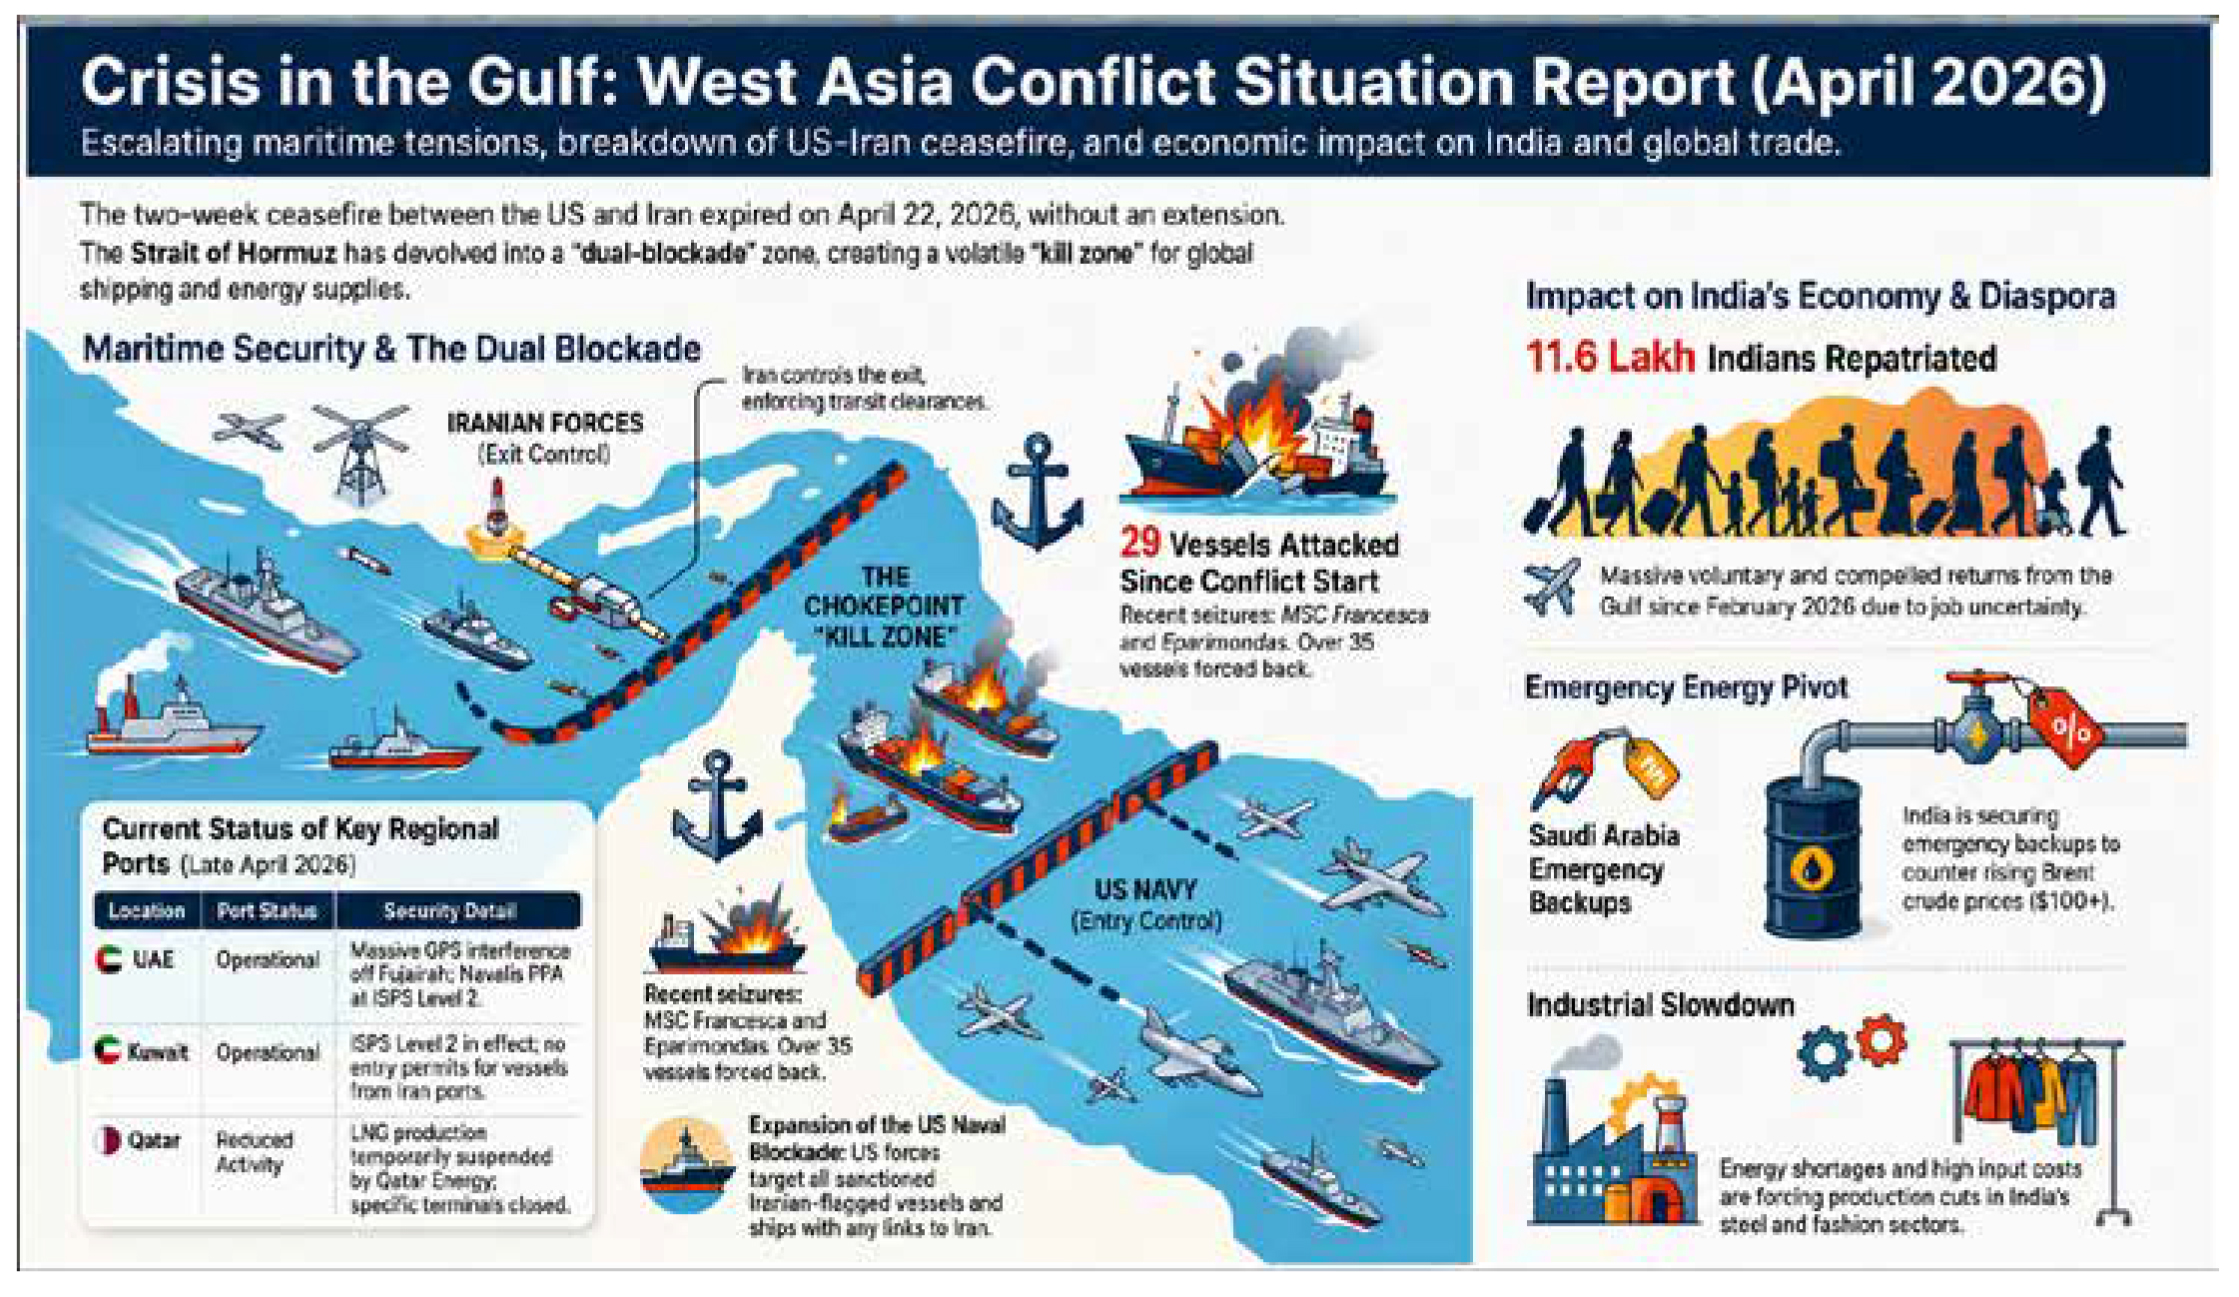
The single most important driver behind this surge was
the near shutdown of the Strait of Hormuz, the world’s
most critical oil transit route. By late April, the strait was
functioning at only a fraction of its normal capacity,
effectively removing an estimated 8–10 million barrels
per day from global supply. This created an
unprecedented supply shock, as major producers in the
region—including Iraq, Saudi Arabia, and the UAE—were
unable to export oil safely. Tanker disruptions forced
rerouting around Africa, sharply increasing freight and
insurance costs and amplifying the price spike.
Geopolitical escalation further intensified the rally. The
deepening conflict involving the US, Israel, and
Iran—particularly the announcement of a naval blockade
against Iran—convinced markets that supply disruptions
would persist. Repeated threats and attacks on regional
energy infrastructure sustained a high “war premium” on
oil prices, with traders pricing in worst-case scenarios of
prolonged conflict. This geopolitical risk alone added an
estimated $10–20 per barrel to crude prices during peak
tension periods.
Another major factor was structural instability within the
global oil supply system. The unexpected exit of the
OPEC+ alliance by the UAE in late April weakened the
cartel’s ability to manage supply and maintain price
discipline. This move created uncertainty about future
production coordination and further destabilized market
expectations at a time when supply was already
constrained. Combined with existing production cuts
and limited spare capacity, the market had little buffer to
absorb shocks, making prices highly sensitive to
disruptions.
Demand-supply dynamics also played a critical role.
Global inventories were already low due to high refinery
utilization and limited stockpiling in late 2025. When
supply disruptions hit, there was insufficient buffer stock
to stabilize markets. Although high prices eventually led
to some demand destruction—particularly in sectors like
aviation and petrochemicals—the initial impact was a
sharp upward adjustment in prices as buyers rushed to
secure supply. Strategic petroleum reserve releases and
alternative supply routes helped partially offset the
deficit but were insufficient to fully stabilize the market.
Speculative activity amplified the price movements.
Hedge funds and commodity traders increased long
positions in crude futures, driving prices higher with
each escalation headline. At the same time, volatility
remained elevated, as any signs of diplomatic progress
triggered profit booking and temporary pullbacks. This
created a cycle of sharp rallies followed by corrections,
without fundamentally reversing the upward trend.
Toward the end of April, prices showed signs of
moderation due to emerging diplomatic efforts,
including initiatives to secure shipping routes and
modest production increases from remaining
producers. However, these measures only partially
eased supply concerns, and crude prices remained
elevated, reflecting a persistent risk premium.
In summary, April 2026 was a geopolitics-driven oil
shock. Prices surged not just because of actual supply
losses, but because of the fear of prolonged disruption
in critical energy corridors. Tight supply conditions,
weak inventories, cartel instability, and speculative flows
all magnified the impact, highlighting the fragility of
global oil markets and their sensitivity to geopolitical
risk.
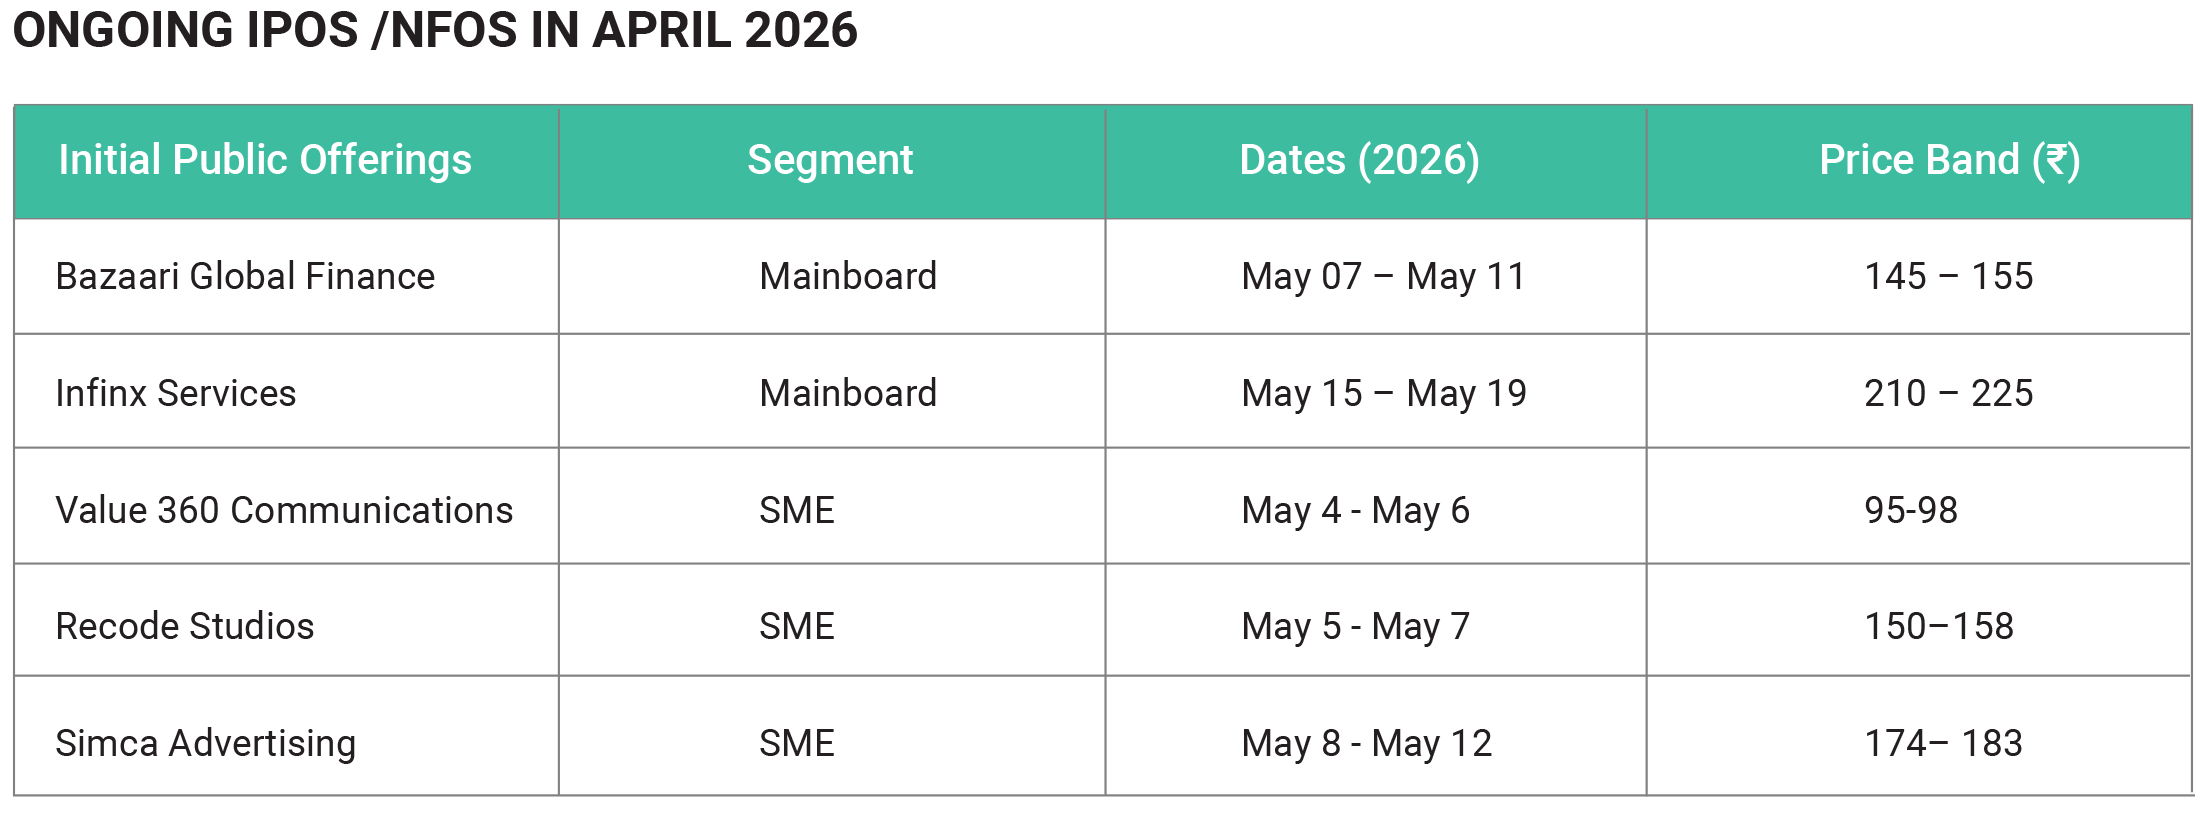
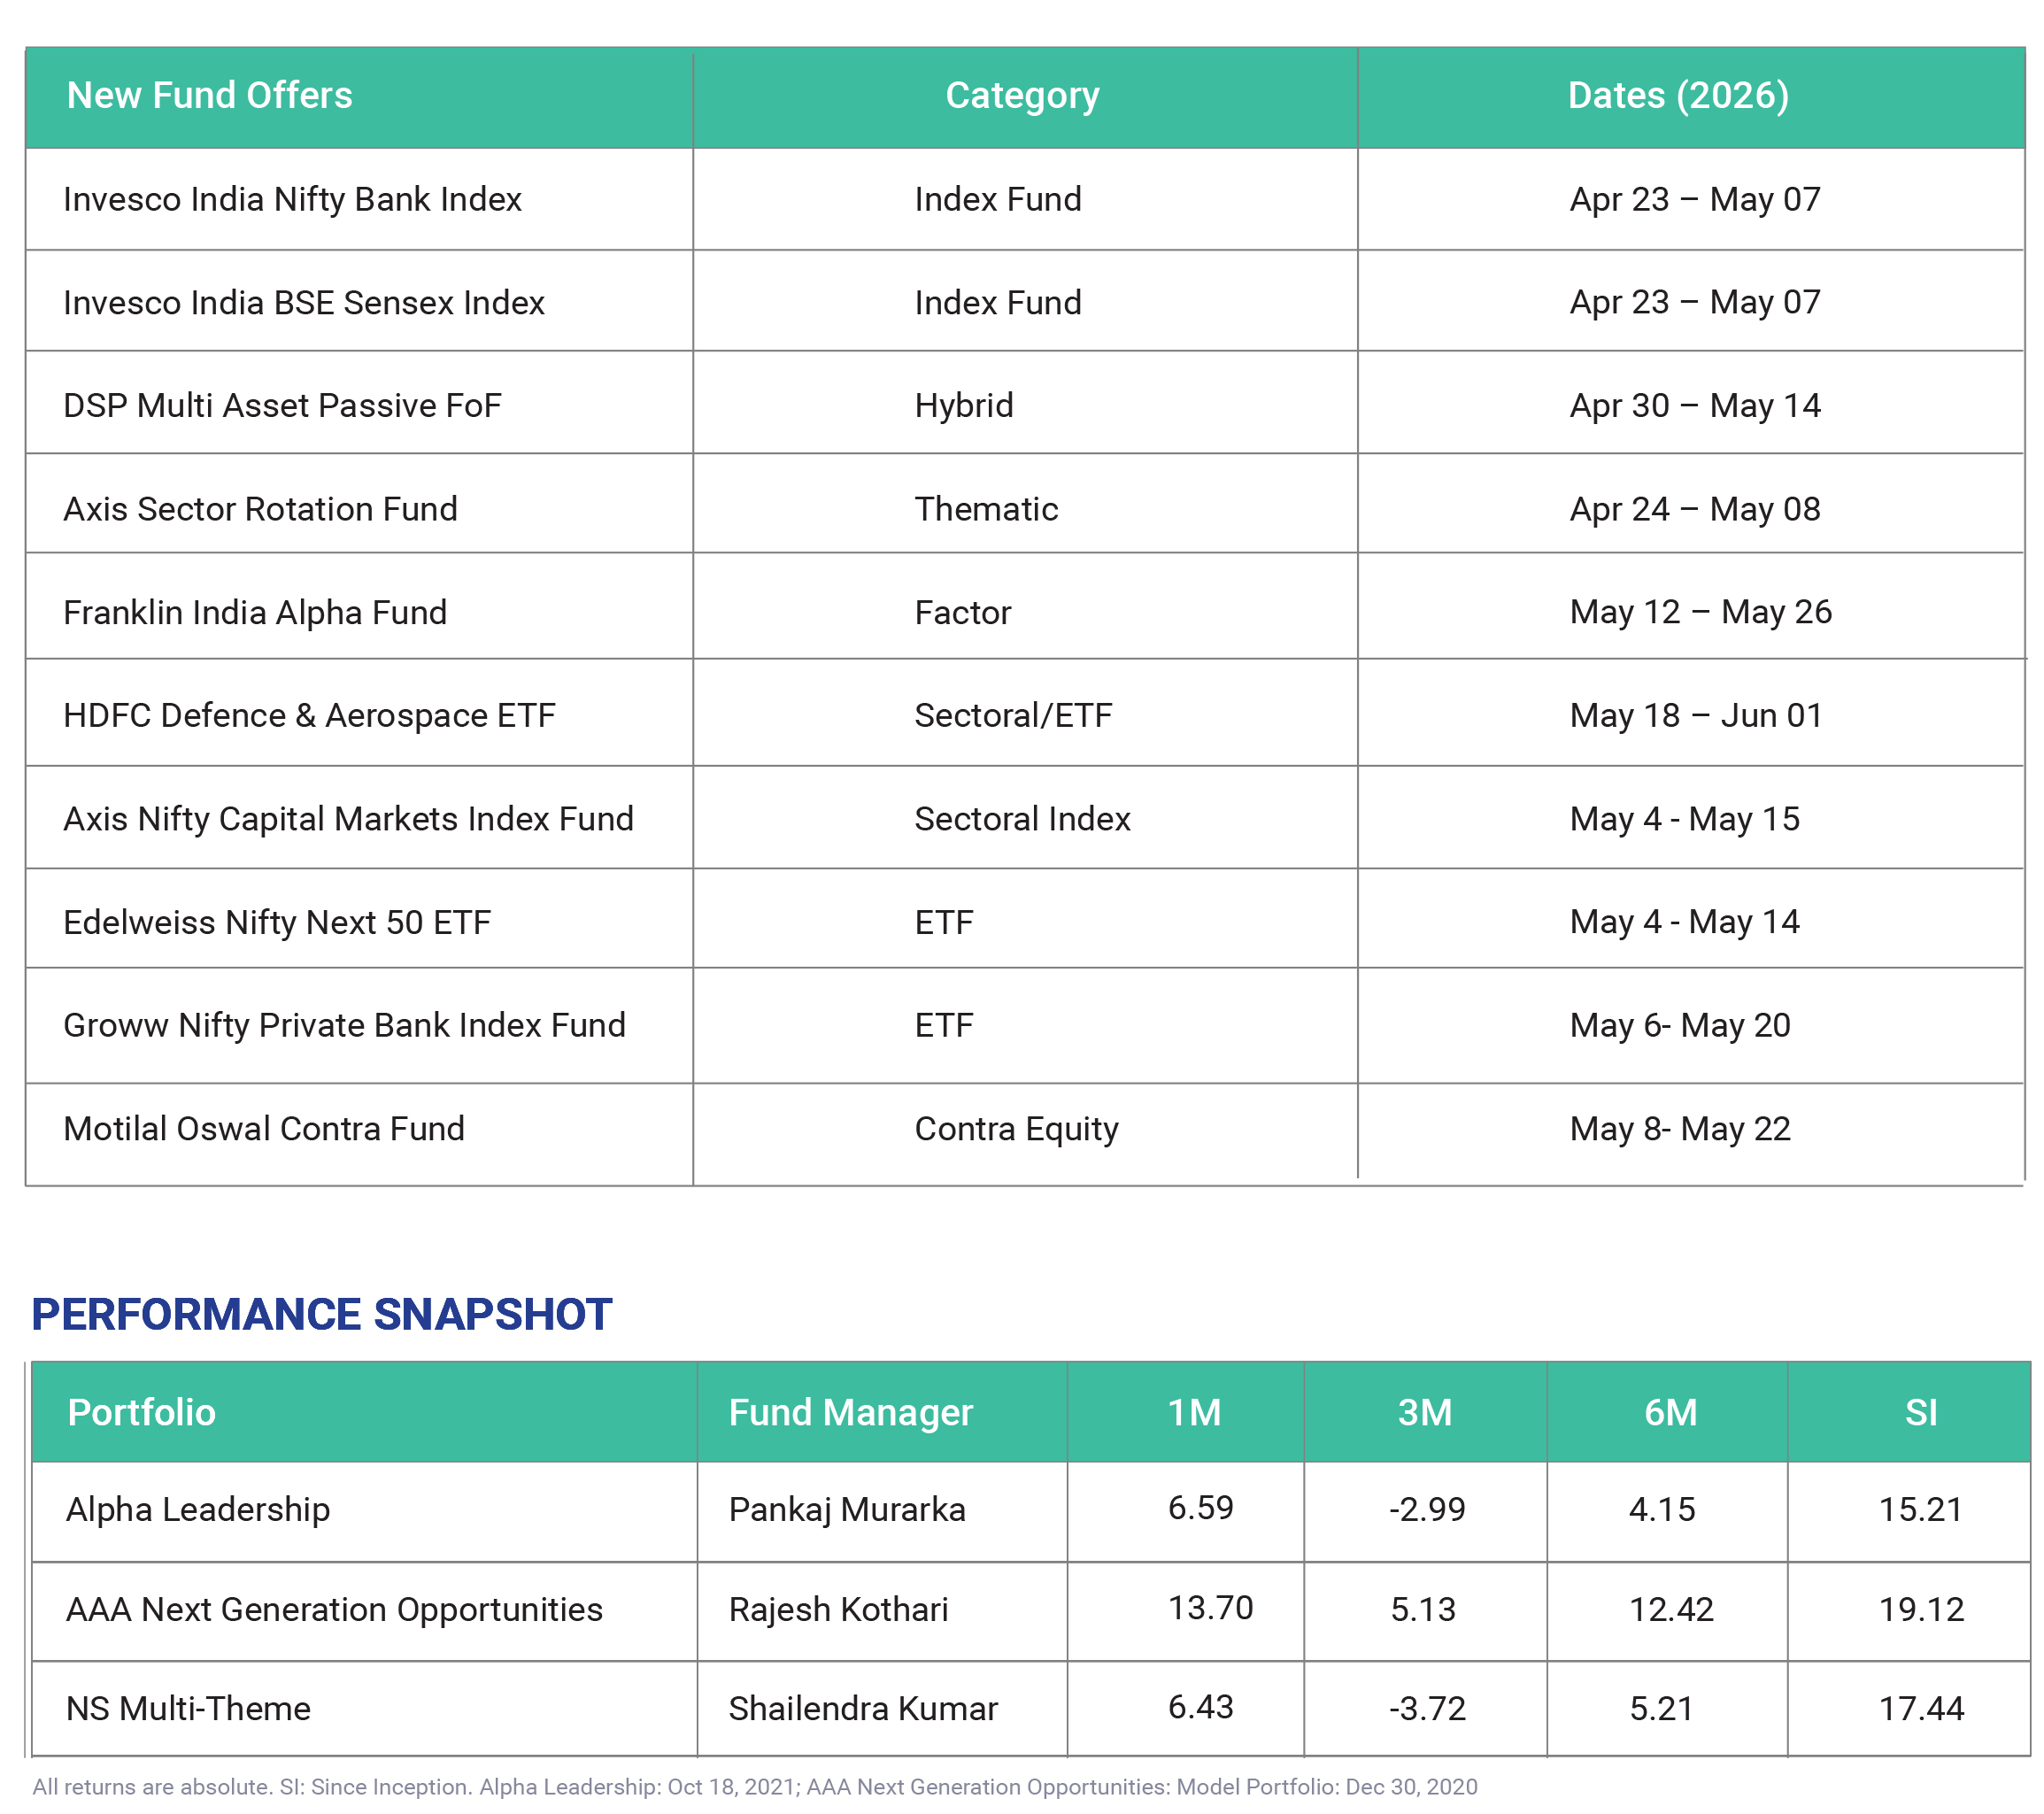
April 2026 marked a landmark phase for the Indian mutual fund industry, characterized by strong performance, major regulatory reforms, and evolving product innovation. Equity mutual funds delivered exceptional returns during the month, with over 25 schemes generating more than 25% returns, driven largely by a sharp market rebound and sectoral rallies. Small-cap funds emerged as standout performers, delivering returns in the range of 17–20%, reflecting renewed investor confidence after a period of caution. Several fund houses even reopened select small-cap schemes for lump-sum investments, signalling improved liquidity and sentiment. Sectoral and thematic funds also outperformed, benefiting from strong gains in industrial products, construction, and electrical equipment sectors, while large-cap and diversified funds offered relatively moderate but stable returns amid ongoing market volatility. A major highlight of April was the implementation of sweeping regulatory reforms by the Securities and Exchange Board of India through the new Mutual Fund Regulations 2026, effective from April 1. These reforms significantly enhanced transparency, governance, and investor protection. One of the most important changes was the restructuring of the Total Expense Ratio (TER), which is now unbundled into components such as Base Expense Ratio, brokerage, and statutory costs, making fund charges more transparent. Additionally, expense caps were slightly reduced, ensuring lower costs for investors. The regulations also introduced stricter rules for thematic and sectoral funds under a “true-to-label” framework, requiring greater portfolio differentiation to ensure genuine exposure. Another key structural shift was the introduction of Life Cycle Funds, a new category designed for long-term, goal-based investing, particularly retirement planning. These funds automatically adjust asset allocation from equity to debt as investors age, replacing older solution-oriented schemes like retirement and children’s funds, which are gradually being phased out. This marks a transition toward more flexible and investor-friendly products. April also saw continued innovation and expansion in product offerings. New Fund Offers (NFOs) from asset management companies, including hybrid index funds and multi-asset fund-of-funds, highlighted a growing emphasis on passive and diversified investment strategies. This reflects a broader industry trend toward cost efficiency and asset allocation-based investing. On the operational side, investor security received a boost with the introduction of features like the “folio lock” or voluntary debit freeze by major fund houses. This allows investors to temporarily block redemptions or withdrawals from their accounts, adding an extra layer of protection against fraud and unauthorized transactions. Despite global uncertainties, the industry demonstrated strong resilience. Total assets under management (AUM) remained robust, reaching around ₹73 lakh crore, supported by consistent Systematic Investment Plan (SIP) inflows exceeding ₹31,000 crore. However, the debt mutual fund segment faced pressure, with notable outflows driven by rising yields and tight liquidity conditions. Overall, April 2026 was defined by a combination of strong equity performance, regulatory transformation, and structural evolution. The industry not only delivered impressive returns but also laid the foundation for greater transparency, investor protection, and long-term growth through innovative products and reforms.